Environmental Friendliness
As a part of the world, KYEC Group dedicates itself to environmental protection, energy-saving, and pollution prevention. We also formulated environmental policies as references, which are all published on our website (https://www.kyec.com.tw/zh-tw/Policy). Currently, all KYEC Group’s production bases worldwide have been certified by ISO 14001 system. In the future, we plan to accredit more environmental management-related systems through ISO 14064 and ISO 50001 (as follows). We will keep improving our management systems following the PDCA cycle and enhance their performance. We have high hope to contribute to global environmental protection.
|
Description of the plant coverage for the environmental management system |
||||||
|
Management System |
KYEC |
KLT |
ZKT |
Coverage |
||
|
Hsinchu Factory |
Chu Nan Factory |
Tungluo Factory |
||||
|
ISO 14001 Environmental management system |
● |
● |
● |
● |
● |
100% |
|
ISO 14064 Greenhouse gas inventory |
● |
● |
● |
● |
● |
100% |
|
ISO 50001 Energy management system |
● |
● |
● |
● |
● |
100% |
|
ISO 46001 Water resource management system |
● |
● |
● |
- |
- |
60% |
1 、Energy Management
- Energy Consumption
In order to effectively improve the Company's energy efficiency, we began implementing the ISO 50001 energy management system standard in 2019. In accordance with ISO 14064-1: 2018 and GHG PROTOCOL greenhouse gas inventory standards, we conduct energy resource inventory, monitor energy use through onsite installed meters, directly measure energy usage, estimate energy consumption within facilities through intermittent transient measurement analog methods. The Safety and Risk Management Department is responsible for consolidating energy usage across all operational sites, understanding the major energy types in each location, and formulating energy conservation improvement plans and short, medium, and long-term targets. In addition, the Department conducts annual internal audit training (three hours) to train internal auditors to regularly supervise the implementation of energy policies and adjust energy plans in a timely manner to ensure energy conservation targets are achieved. As of the end of 2024, all five factories have passed ISO 50001 external verification. The Company also strengthens the promotion of corporate energy conservation policies by organizing related advocacy activities and plant-wide energy literacy training courses to enhance employees' awareness of energy conservation and carbon reduction.
King Yuan Group Energy Consumption Analysis (Unit: Gigajoule GJ)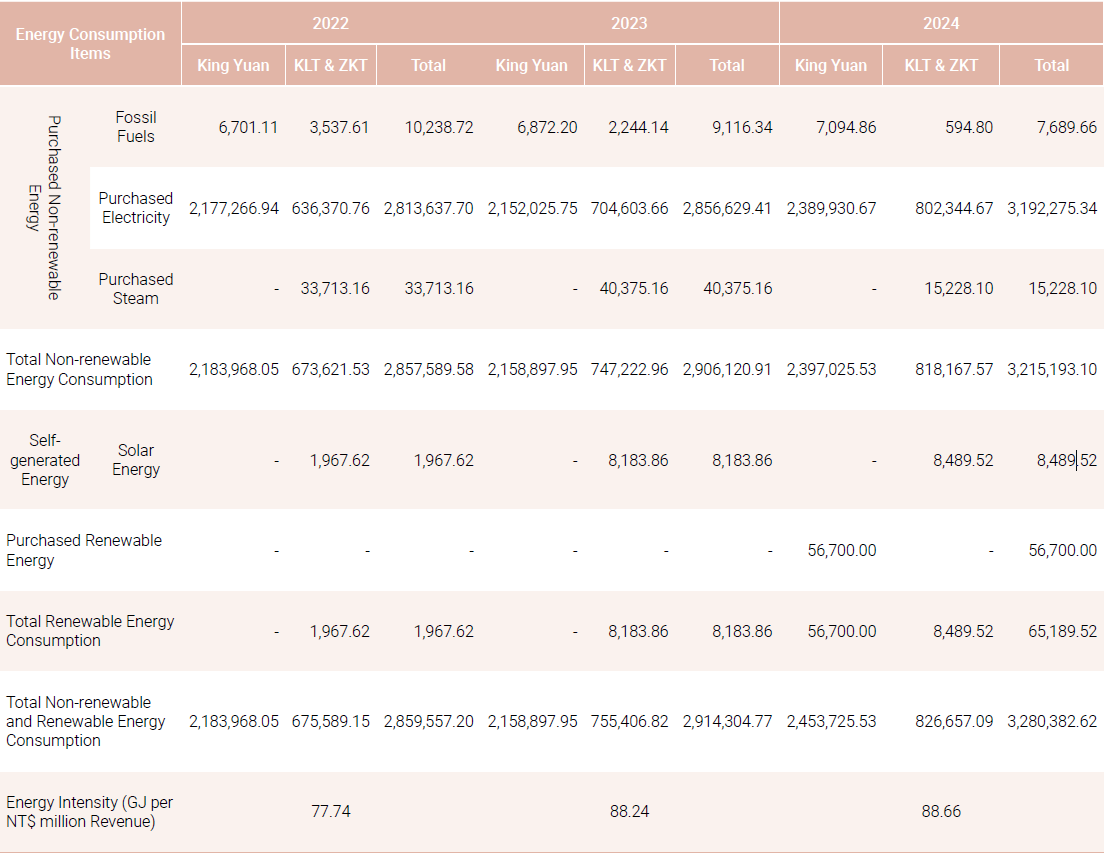
Note 1: Taiwan's calorific values are based on those announced by the Bureau of Energy, Ministry of Economic Affairs. Energy consumption is calculated by multiplying energy usage by unit calorific value and converting to gigajoules (GJ).
Note 2: China's fuel calorific values are estimated and calculated based on the National Standards of the People's Republic of China; gasoline density uses the median value for calculation.
Note 3: Steam is only used by KLT & ZKT, so China's calorific value conversion is adopted, with 1 ton of steam equivalent to approximately 2.77712GJ
Note 4: As of the reporting year, solar self-generation and self-consumption facilities only include KLT.
Note 5: As of the reporting year, purchased renewable energy is only at KYEC
Note 6: As the Company is a manufacturing industry, NT$ million revenue is selected as the denominator for intensity calculation.
- Energy Saving Measures
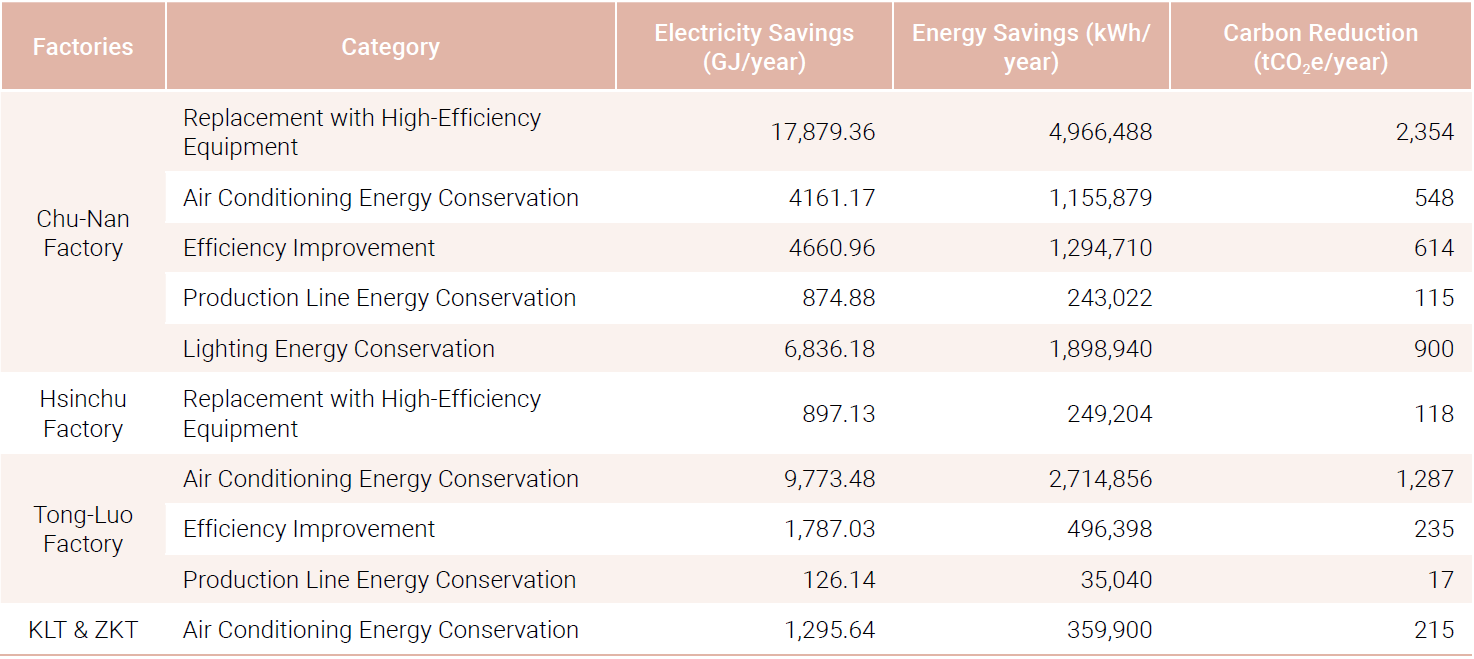
To improve the Company's energy use efficiency, King Yuan Group has set 2020 as the baseline year. In order to internalize energy conservation concepts into all energy-using units within the organization, the company has internally increased the energy conservation target from the previous annual electricity saving rate of 1% to 1.5%. Through internal energy planning guidelines and energy management standards, the Company incorporates energy equipment efficiency standards into energy conservation planning and design as priority choices for future modifications, replacing obsolete equipment and enhancing unit energy use efficiency. The medium-term target is to achieve cumulative electricity savings of 75 million kWh by 2030, and as of the reporting year, cumulative electricity savings have reached 61.19 million kWh. In 2024, the Company implemented 38 energy conservation projects, achieving a total energy savings of 45,973.0553 GJ. The main energy conservation strategies include replacing high energy-consuming equipment with energy-efficient equipment and improving equipment energy use efficiency, as well as introducing low-carbon processes. In 2024, the Company planned to implement automated control systems to regulate machines entering energy saving mode, using programmable controls to shut down components such as machine heaters after a certain standby time, thereby reducing energy consumption of non-essential operating components during machine standby periods.
King Yuan Group Energy Saving Projects by Plant
.png)
- Renewable Energy
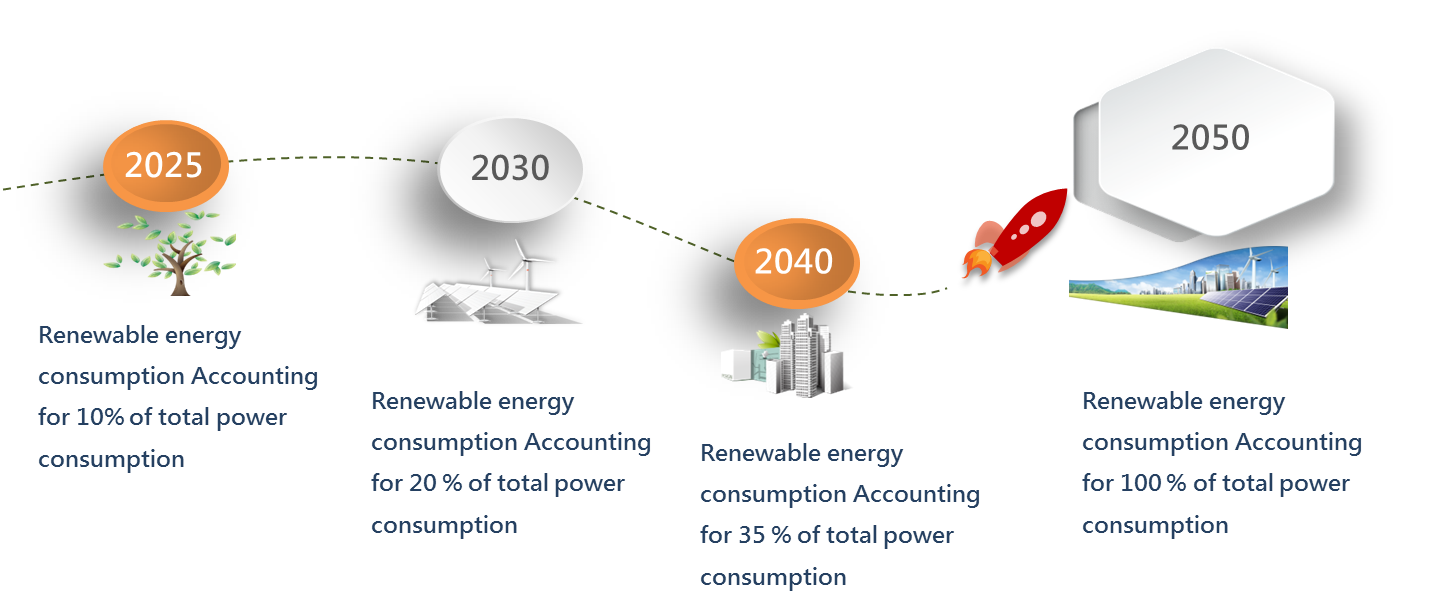
TheFor renewable energy action planning, KLT completed the construction and power generation of solar power systems in August 2022, and Tong-Luo Factory in January 2024 (only King Long (KLT) is for self-generation and self-consumption). Chu-Nan Factory plans to complete the construction of solar photovoltaic facilities by 2026. In addition, KYEC used 15.75 million kWh of renewable energy through external procurement and renewable energy wheeling in 2024, accounting for 2.37% of KYEC's total electricity consumption. The target is to reach 10% of total electricity consumption by 2025, 20% by 2030, 35% by 2040, and 100% by 2050. The Company considers continuous improvement of green production performance as a key action.
2 、Greenhouse Gas Emission and Management
- Greenhouse Gas Inventory and Analysis
Greenhouse Gas Emissions Analysis (Unit: tCO2e)
.png)
Note 1: Starting from 2022, the coverage scope encompasses all parent and subsidiary companies in King Yuan Group's consolidated statements.
Note 2: In 2024, KYEC adopted GHG Protocol inventory standards. KLT and ZKT adopted ISO 14064-2018 inventory standards.
Note 3: KYEC includes three factories in Taiwan and offices in the United States, Japan, and Singapore.
Note 4: In 2022, King Yuan Group adopted ISO14064-2018 inventory standards; the inventory scope included categories 1-4. Since KYEC switched to GHG Protocol inventory standards starting in 2024, the 2022-2023 King Yuan Group categories 3-4 data have been combined into Scope 3.
Note 5: We use the emission factor method for calculations. KYEC emission factors are sourced from the latest "Greenhouse Gas Emission Coefficient Management Table" (version 6.0.4) published by the Ministry of Environment, Executive Yuan. King Long &Zhen Kun emission factors are sourced from the 2006 IPCC National Greenhouse Gas Inventory Guidelines (2019 revision). GWP values are all adopted from the IPCC Sixth Assessment Report. Activity data sources include engineering calculations, mass balance, and other supporting documents.
Note 6: the Company has no emissions from biomass combustion or Scope 1 per fluorinated gases.
- Greenhouse Gas Reduction
Since 2022 was the first year King Yuan Group completed its greenhouse gas inventory, 2022 was set as the baseline year with a target to reduce emissions by 15% by 2030 compared to the baseline year. We have adopted the following action measures and regularly track performance results:
Emission Reduction Action A: Purchase renewable energy and carbon credits. In 2024, through the purchase of renewable energy, we reduced Scope 2 emissions by 7,466 tons.
Emission Reduction Action B: Implement various energy-saving projects within facilities and replace existing refrigerants with environmentally friendly refrigerants.
Emission Reduction Action C: Install solar power generation systems on the rooftops of all factories.
Emission Reduction Action D: Continue to shift waste disposal from incineration to reuse forms, for example: waste empty containers.
Emission Reduction Action E: Continue green transportation carbon reduction. Since 2024, we have collaborated with waste disposal contractors. Through waste compression and volume reduction processing, we can reduce the number of collection vehicle trips, with an estimated annual reduction of 6,000 tons of Scope 3 emissions in the future.
Emission Reduction Action F: Evaluate the use of low-carbon packaging materials; provide guidance to suppliers for carbon footprint inventory.
.png)
We use the energy management system's energy-saving action plan to calculate the measured power consumption before and after improvements. By multiplying the total electricity savings in 2024 (thousand kWh) by 0.474 (the power carbon emission factor announced by the Energy Administration in 2024), we calculated that King Yuan Group reduced greenhouse gas emissions by approximately 6,403 tCO2e through energy-saving actions, with the main reduction in Scope 2 emissions.
In 2024, King Yuan Group reduced a total of 7,466 tCO2e through purchasing renewable energy, with the main reduction in Scope 2 emissions.
3 、Water Resource Management
- Water Resources Data Overview
Extreme climates caused by global warming affect global water resources and business operations. For example, floods causing severe water damage that renders equipment inoperable, and droughts posing serious threats to agricultural products. Additionally, improper treatment of discharged water may also impact the ecological environment or the health of local residents. Therefore, KYEC manages water resources through the ISO 46001 water resource efficiency management system, using water-saving process design as the standard, and optimizing the use of every drop of water through wastewater recovery and reuse to reduce tap water consumption. Each unit establishes water conservation promotion groups, draws factory water balance diagrams, regularly reviews and audits water usage changes, regularly confirms the efficiency of facilities within the factory, and replaces water-consuming equipment to avoid waste.
- Water Resource Overview (Unit: million liters or thousand cubic meters)
.png) Note 1: Recycling percentage = Recycled water volume ÷ Total water withdrawal in all regions
Note 1: Recycling percentage = Recycled water volume ÷ Total water withdrawal in all regions
Note 2: Recycled water volume = Recycling systems, rainwater harvesting, pure water reuse
- Water Withdrawal and Reuse
KYEC's primary source of water withdrawal is tap water. In 2024, total water withdrawal was 2,254.766 million liters, with withdrawal volume remaining flat compared to 2023. Water withdrawal intensity per unit revenue (including rainwater) was 11% lower than the previous year, achieving the water conservation target of a 4% reduction from the baseline year 2020.
In 2024, King Yuan Group implemented a total of seven water conservation action plans across all factories. Tong-Luo Factory constructed domestic wastewater treatment facilities and cooling tower wastewater recovery systems to ensure recycled water quality meets internal recycling standards, enabling water recycling and circulation while complying with the Tong-Luo Science Park discharge standards. King Yuan Group continues to implement daily water conservation and wastewater recycling and reuse through concrete water-saving improvement plans, striving to achieve optimal efficiency in water resource utilization.
.png)
4 、Waste Management
- Waste Impact Assessment
The Company references domestic and international environmental impact reports, considering all stages of the life cycle (raw material extraction, production and manufacturing, sales and distribution, product use, and waste disposal stages) to identify waste generated by operational activities within the organization and throughout the upstream and downstream value chain. The Company evaluates the potential environmental and social impacts of waste and accordingly creates a context map of the Company's value chain and waste impacts.
The Company's generated waste includes both hazardous and non-hazardous industrial waste, mainly consisting of mixed plastic waste, mixed paper waste, inorganic sludge, and other types of waste. We develop corresponding management measures in response to the potential impacts of various types of waste, with waste management units regularly supervising and evaluating implementation effectiveness to mitigate or avoid negative impacts on the internal organization or external environment.
.png)
- Waste Management Policy
The Company, guided by its environmental policy, sets various waste reduction targets, continuously promotes and prioritizes the procurement of green and environmentally friendly products, and regularly reviews the achievement of these targets. Through efforts in recent years, the Company has increased its waste reuse rate from 80.4% in 2020 to 85%, continues to seek reuse institutions, and plans to convert waste liquids and waste aluminum foil bags from incineration treatment to recycling and reuse by 2025, achieving the goal of waste resource reuse.
- King Yuan Group Waste Management Strategy and Objectives
.png)
- Summary Table of Industrial Waste Generation, Transfer in Disposal Process, and Direct Disposal (Total of All Sites, Unit: Tons)
.png)
Note: The classification of hazardous and non-hazardous is determined according to the local regulations of each location.
- UL2799 Zero Waste to Landfill Certification
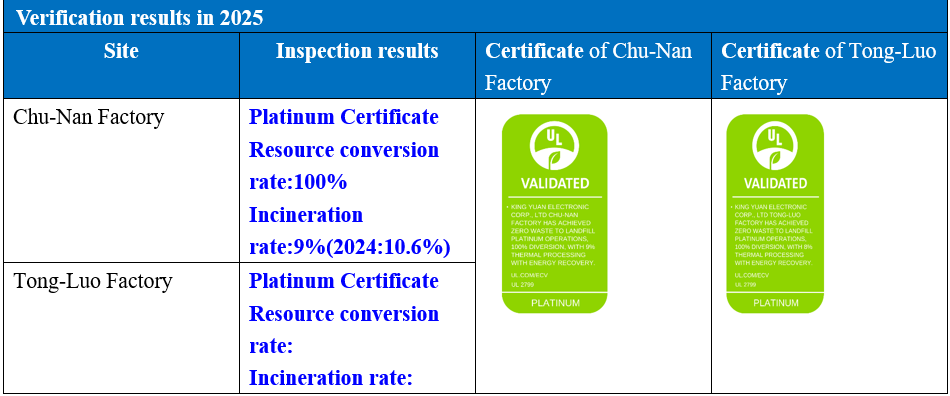
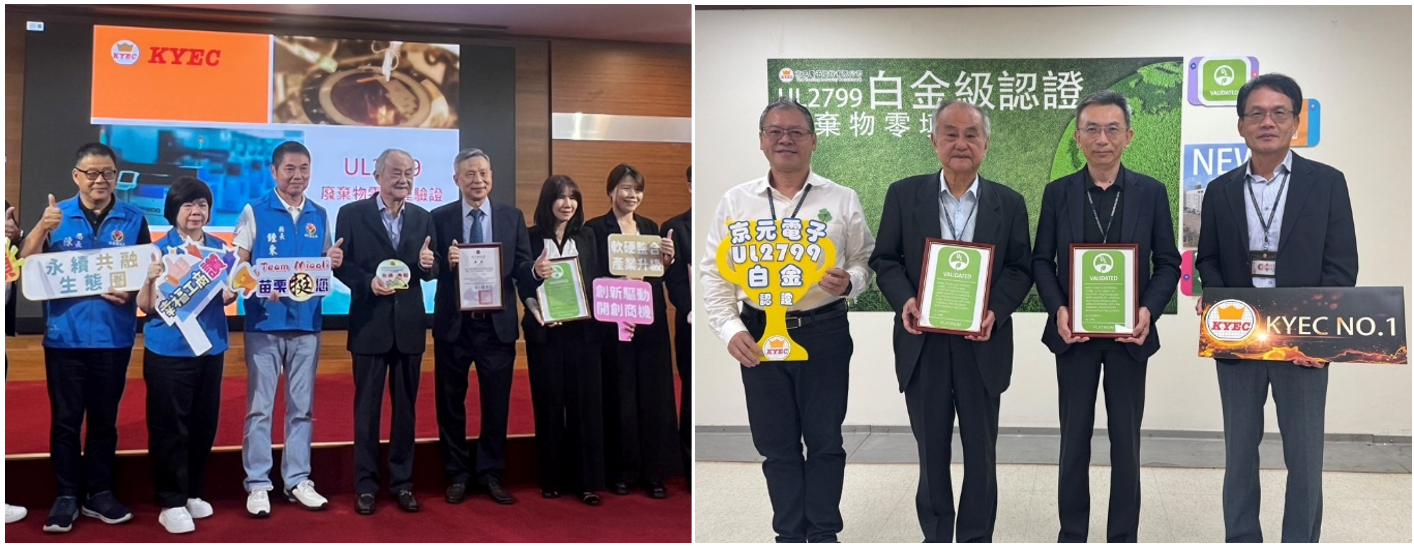
Since 2013, our company has been promoting UL2799 zero landfill certification, achieving the sustainable goal of converting waste into resources through recycling, reuse, and composting. Our Zhunan and Tongluo plants have achieved a "100% waste conversion rate."
